Investing in Movement: Physical Activity Drives Economic Growth | Infographic

Explore the economic cost of physical inactivity and discover how regular activity reduces healthcare expenses and boosts productivity. Infographic developed by the ACSM American Fitness Index.
ACSM Announces Nation’s Fittest Cities; Food Insecurity, Wildfires and Pickleball Emerge as Factors

American Fitness Index ranks 100 largest cities based on 35 indicators Despite a significant increase in Americans’ aerobic and strength activity, external factors like smoke-filled air and the lapse of a Covid-era food program may be making us less fit overall. Those are the primary conclusions from the 18th annual ACSM American Fitness Index® (Fitness […]
2025 ACSM American Fitness Index Infographic
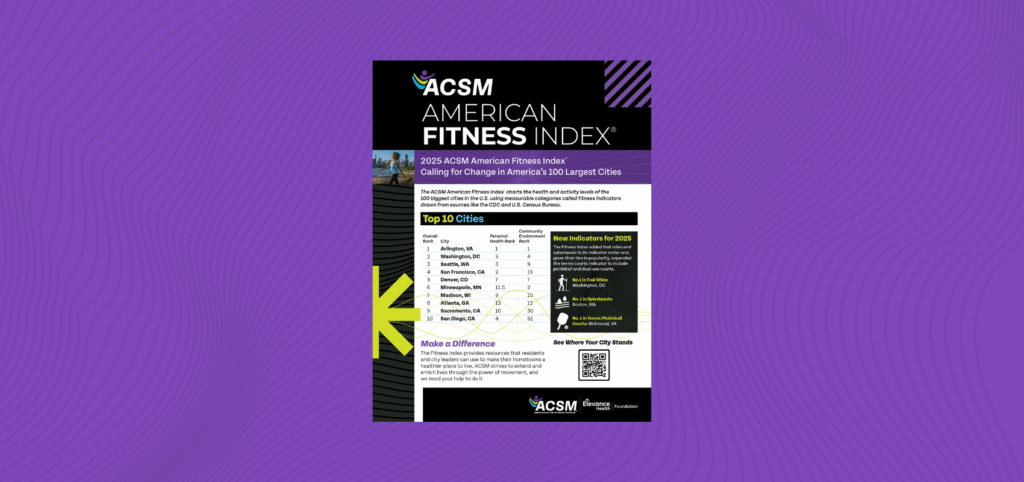
View the top 10 cities and learn about the new indicators from the 2025 American Fitness Index rankings.
A Quick Guide to Advocacy

Want to make a difference in your community? Four tips to get yourself started in participating in local advocacy.