Tag: ACSM American Fitness Index

fresh produce with the fitness index logo

Food Insecurity: Defining and Addressing a Community Health Challenge

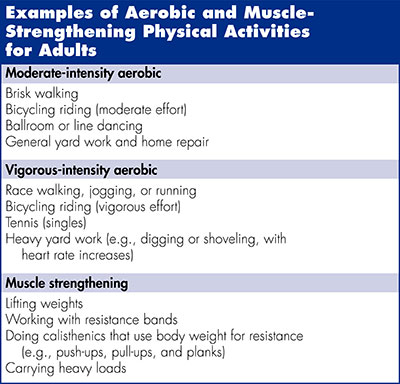
Food insecurity is defined by the U.S. Department of Agriculture (USDA) as   “a household-level economic and social condition of limited or uncertain access to adequate food.”  Generally, this indicator refers to households who don’t have enough food, particularly healthy food, to eat due to a lack of money and other resources. There are slight variations in how different organizations define food insecurity, but all relate to households who lack healthy food.   

How big is the problem? 

During the  COVID-19 pandemic, a spotlight was focused on food insecurity as many individuals lost their jobs, schools closed resulting in children not getting meals there and other normal sources of food were curtailed, resulting in households being unable to obtain all of the food that they needed. The U.S. Census Pulse Survey results indicate that those who sometimes or often did not have enough to eat due to lack of resources increased from about 20% pre-pandemic to 28% by mid-2021.  

10 US cities with lowest rates of food insecurity in 2021

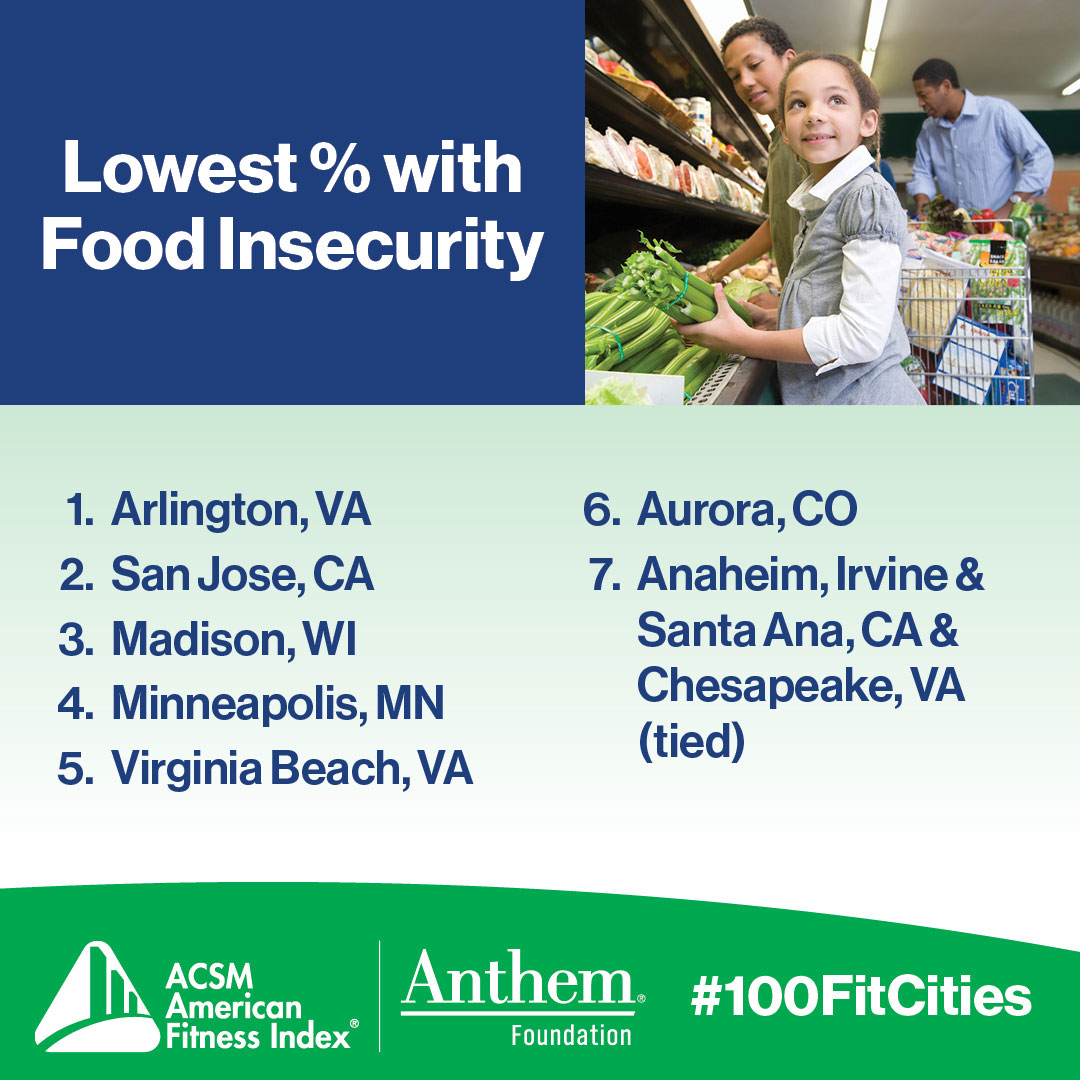
The Feeding America non-profit group produces annual “Map the Meal Gap” reports that include estimates of food insecurity at the city level.  Their most recent report (2020) was used as the measure of food insecurity in the 2021 American Fitness Index (Fitness Index). Feeding America uses U.S. Census Current Population Survey data to measure of food insecurity based on a well-established statistical model using unemployment rates, median incomes, racial demographics and other factors shown to be determinants of food insecurity. Across the 100 cities included in the 2021 Fitness Index, there was almost a three-fold difference in the percentage of households with food insecurity, from a low of 6.7% for Arlington, VA, to a high of 18.2% for St. Louis, MO.  

What is the impact of food insecurity? 

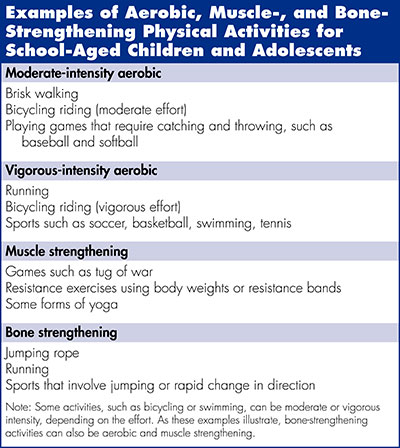
A considerable amount of research  has examined the physical and mental impact of food insecurity, including poor physical health outcomes, inadequate intake of key nutrients for optimum functioning and increased risk of chronic disease. Associations also exist between food insecurity and obesity along with poor glycemic control among those with diabetes. Of particular concern from a fitness perspective is that food insecure households may not consume an adequate amount of protein, a nutrient essential for a variety of bodily functions, including building and repairing muscles,  bone health and development and stabilizing blood sugar.  

Healthy cognitive,  psychological and emotional development among children is also dependent on them consuming sufficient amounts of nutritious food. America’s poor and near-poor children are at higher risk of lower academic achievement and behavioral problems. Food insecurity has been associated with poor psychological and cognitive functioning, higher probability of behavioral problems and higher levels of aggression and anxiety among children. Food insecure women are more likely to experience prenatal depressive symptoms than food secure women. Another consequence of food insecurity is poor sleep which can cloud thinking and lower energy, as well as decrease the ability to make good decisions. The profound impact of food insecurity on individuals’ physical and mental health made a clear case for adding this indicator to the Fitness Index.  

How is food insecurity addressed at a policy level? 

The federal government  recently expanded the Supplemental Nutrition Assistance Program (SNAP), Women, Infants and Children (WIC) and other safety net programs that support low-income children and mothers during the pandemic to help increase access to food among those in need. These programs provide more than half of all food support for households in need. The USDA has also funded innovative demonstration projects such as creating and distributing meal boxes that contain a week’s worth of groceries that can be delivered to those in need. 

What can city officials do to reduce food insecurity  locally?  

In addition to supporting existing food banks, pantries and other food providing programs, many city  officials have supported the development and maintenance of innovative and effective programs to improve access to healthy food. The following examples offer city officials, local businesses and residents an opportunity to get involved in reducing food insecurity in their communities. 

  • Organize food providing programs into a network that shares  information and resources as well as analyzes food need patterns to build capacity in advance of expected needs.  
  • Develop apps or websites  to make local food resource information readily available. Information about food access is a critical resource particularly for households newly in need. 
  • Establish mobile food pantries and farm produce trucks to carry needed food into the food deserts and to others in need of food.  
  • Partner with  farm-to-table and farm-to-school programs which are effective ways to ensure those in need have access to fresh produce while at the same time supporting local farmers.  
  • Start  community gardens, using city property when allowed, as public gardening spaces. Those interested are assigned an area in a shared garden where they can grow fresh fruits and vegetables. Seeds, water, tools and other resources are often provided or shared when available.  
  • Create a  food rescue program that gathers unused food from restaurants and similar food preparation organizations that might have otherwise been discarded, and distribute these food items to agencies that provide hot meals to those in need. Alternatively, food rescue programs can work with local farmers to glean what is left in farmers’ fields after their harvest. This rescues fresh fruits and vegetables that would otherwise go to waste in fields. 
  • Support organizations that help those in need understand their eligibility for benefits and help them navigate the application process. State agencies are responsible for distributing  SNAP and WIC benefits, but many eligible people are not enrolled because applying for these benefits can be cumbersome and confusing.  

While the problem is  large, there is much we can all do to reduce food insecurity across the country. Clearly, having access to healthy food is important in all cities, and innovative, effective programs can be used by city officials to improve the access.  

If you or someone you know is experiencing food insecurity, you can find help at  www.feedingamerica.org/need-help-find-food.  


Author: Terrell W. Zollinger, DrPH, Professor Emeritus, Indiana University 

child climbing at a park

The American Fitness Index in 2020 | The Essential Nature of Parks

For more than a decade the ACSM American Fitness Index® has provided an annual snapshot of community fitness for some of the largest cities and metro areas in the United States. From the start, the Fitness Index acknowledged the importance of parks, recreation facilities and assets like playgrounds, tennis courts and swimming pools. Not only are these resources for physical and mental health, they are civic, social and economic drivers. In a word, parks and recreation are essential.

Parks and public spaces are having a moment in 2020. The last four months have seen extraordinary changes for American cities and their residents. When the COVID-19 pandemic started spreading across the U.S., public officials closed schools and government offices, issued stay-at-home orders and restricted travel to only essential functions. With more time at home, many people did something they’ve never done before – they visited their local parks, walked on a neighborhood trail or dusted off their bikes and rode with confidence in a bike lane for the first time. City infrastructure like parks, trails, sidewalks and bike lanes were viewed in a whole new light. They were no longer just nice-to-have amenities; instead they quickly became essential public resources.

As the days and weeks wore on, parks transformed into escapes from our homes. On a dime, parks departments moved from organizing summer rec leagues and swimming lessons, to providing meals for school children, and eventually, to any person experiencing food insecurity. Parks departments also offered childcare for front-line workers, a critical component for ensuring workforce capacity was maximized.

Parks are much more than ball fields, picnic tables and charcoal grills. Parks are civic places as well, essential for historic and current protests seeking social justice and human rights. From speeches and marches on the National Mall to demonstrations in local parks, these public spaces have a long history of serving as a platform for change makers.

This agility and willingness to meet the needs of the community is not new to parks departments. For years they have delivered essential services, but rarely have they been funded at levels that reflect their value to the community. As the economic recession deepens, city tax revenue is in steep decline. Parks departments face dramatic budget cuts, hiring freezes and layoffs. Despite having filled critical gaps in the community, while generating more than $166 billion in economic activity and supporting more than 1.1 million jobs, public officials do not perceive parks departments as contributing to their biggest concern – economic development.

Parks, trails and recreation facilities attract business development and new residents, shape the quality of life for entire neighborhoods, and drive investment in communities. It is in all of our interest to call on public officials at all levels of government to increase funding for parks and recreation and to ensure equitable distribution of funds, resources and programming. As the writer and journalist Marty Rubin said, “Parks and playgrounds are the soul of a city.”

Authors: Barbara Ainsworth, Ph.D., M.P.H., FACSM, FNAK, Arizona State University; Stella Volpe, Ph.D., R.D.N., ACSM-CEP, FACSM, Virginia Tech; Gretchen Patch, M.P.H. , American College of Sports Medicine

Intentional Daily Movement | Coping with the COVID-19 Pandemic

My name is Olivia Affuso and I am a streak runner. I have run at least one mile every day for the last 600 consecutive days. This may seem like a lot, but there are people like Jon Sutherland who has been running every day for more than 50 years! Now, that, is a lot of running. Of course, this is more than enough, but the science is clear: We humans need regular physical activity to stay mentally and physically well.

Getting started can be tough as people move from ‘just thinking about it’ to actually engaging in physical activities like brisk walking, running or strength training. Research suggests that it takes about 66 days to establish a habit, and additional strategies may be needed to recover from any unexpected breaks due to injury and other things. Keeping it going long-term can be a challenge. Let’s just say, life happens.

2020 has thrown us all a serious curveball with the ongoing COVID-19 pandemic. Many of us have had to change our routines—including those routines for our exercise goals or resolutions that often wane within the first months of the year.

But, how about during the pandemic? My observation, at least via social media, is that more people are engaging in exercise to deal with the stress of the ‘stay-at-home’ measures than before the crisis. I have noticed more live streaming of dance fitness, yoga, body weight strength classes and more. The online running groups I belong to are very active with individuals posting about their progress on one or more virtual races such as the Great Virtual Race Across Tennessee – 1000K, which requires running five miles per day to complete it by the August 31st, 2020 deadline. There are over 18,000 registered participants from around the world. Of course, the number of participants is not evidence that previously sedentary people are getting more active. Hopefully, we will have some data about how COVID-19 is impacting people’s physical activity from a new ongoing study by researchers at Ohio University.

Has the pandemic affected my exercise routine? Absolutely! Initially, I experienced a steep drop in the duration and intensity of my running (from 35 miles to 15 miles/week) due to an increase in caregiving responsibilities as well as transitioning my in-person public health course of 56 students to an online format. However, I did not break my streak. I couldn’t break my streak. There is no way the 300 plus ladies in my online support and accountability group would let me quit without good reason. As a matter of fact, we currently have a 150-day one intentional mile challenge going until the end of May. Many of the women are on track to complete this challenge and several have shared their plans to keep their habit of intentional daily movement going for at least 365 days. Take Lisa for instance. She is a corporate executive who struggled with being consistent with her exercise until she started her first 50-day challenge. Not only is Lisa now meeting the national physical activity guidelines of at least 150 minutes of moderate to vigorous activity, she is walking a 5K every day and six miles virtually on Sundays with friends. She says she has never felt better and has no plans to break her walking streak.

Could this pandemic be your catalyst to start your own movement ‘streak’? Yes! You can do it. Here are my suggestions for getting started:

1) Choose an activity you like to do

2) Set a minimum time or distance for each day

3) Pick a start date

4) Find support

5) Be flexible

6) Have fun!

Of course, check with your physician before starting any exercise routine.


Author: Olivia Affuso, Ph.D., FACSM,  is a faculty member at the University of Alabama and a member of the American College of Sports Medicine Board of Trustees.

blog, health disparities in built environments

Disparities in the Quality of Physical Activity Environments

There are race, ethnic and socioeconomic status (SES) disparities in physical activity. The disparities differ by domain of physical activity (e.g., occupation, transportation), but there is consistent evidence that leisure time physical activity is lower among individuals with lower income and members of most race and ethnic minority groups. One possible explanation of these disparities is that communities of color and those living in lower-SES neighborhoods have lower quality physical activity environments. Environments can be designed to make it easier to be active or to create barriers to physical activity. There are national health objectives and public health imperatives to reduce physical activity disparities and improving environments in disadvantaged neighborhoods could be a strategy for long-term benefits for entire communities.

Our research group has studied disparities in two general types of physical activity environments, or places where people are often active. One is the park environment, the other is the streetscape environment, and both are relevant to leisure time physical activity. Parks are obvious places for recreational activity, but walking is the most common type of activity at virtually all ages, and the most common place to walk is on sidewalks and streets in the neighborhood.


Access to parks and park quality

Past studies of access to parks have produced mixed results about whether there are fewer parks in low-income communities of color. Our research group was particularly interested in whether there were disparities in the quality of parks. We defined quality as the number of different types of sports and physical activity facilities, such as ball fields, trails, basketball courts and playgrounds, as well as number of amenities such as restrooms and water fountains.

We observed 543 parks in and around Baltimore, MD and Seattle, WA neighborhoods selected to vary widely on SES. The results were very different across regions. In the Baltimore region we found the expected lower quality of physical activity facilities and amenities in mostly-minority neighborhoods. In the Seattle region, the surprising result was that lower-income areas had parks with more sports and physical activity facilities and more amenities. We referred to the Seattle pattern as “equitable differences,” meaning these economically deprived neighborhoods needed higher quality parks because they did not have access to fitness centers and exercise programs that required fees and transportation.


Streetscape quality

Studies of overall community design, such as having shops and schools within walking distance, often do not find disparities across race, ethnic and SES groups. However, our interest was in the quality of streetscapes, or the extent to which streets and sidewalks are designed to be comfortable, attractive and safe for pedestrians. We conducted observations in over 2200 locations in Baltimore, MD, Seattle, WA and San Diego County, CA regions. We coded presence and quality of sidewalks, quality and safety of street crossings, aesthetic features like landscaping and indicators of social disorder such as graffiti.

Again, the results were complex. Though there were some differences across regions, there were many more common findings. We found disparities, such that low-income and mostly-minority neighborhoods had worse aesthetic and social-disorder features, such as graffiti, litter, broken windows and fewer trees. But we also saw evidence of “equitable differences,” with high-income and mostly white neighborhoods generally having worse crosswalks, intersections and sidewalks.


Lessons learned: Patterns of environmental disparities are local

Our studies found some evidence of environmental “disparities:” park quality and pedestrian features that were worse in low-income and/or mostly-minority neighborhoods. We also found “equitable differences:” park quality and pedestrian features that were worse in high-income and/or mostly white neighborhoods. These patterns had not been reported before. The park and streetscape features that exhibited disparities varied between cities, but we discovered a clue that helps explain some of the differences by region. In the Seattle region, a King County ordinance guaranteed equal facilities and services across neighborhoods that could explain the high-quality parks in low-income neighborhoods. This is evidence that local policies determine whether there are disparities in physical activity environments.

It should not be assumed that parks and pedestrian streetscapes are lower quality in low-income areas and communities of color. It should also not be assumed all neighborhoods have equal quality physical activity environments. The only way to determine local patterns of environmental disparities is to collect local data, but such data are rarely collected.

Park and streetscape features are modifiable and offer a feasible and affordable approach to creating activity-friendly environments in all neighborhoods.  Conducting observations in numerous neighborhoods can help local policy makers, planners and community groups identify disparities, recommend targeted changes and increase physical activity opportunities for all residents, regardless of race, ethnicity or income. Simple observational measures are available that can be used by community residents to assess their neighborhood environments. Community groups are encouraged to work with government agencies to document the quality of physical activity environments in their neighborhoods and use local data to develop plans for improvement.


References

Thornton, C.M., Conway, T.L., Cain, K.L., Gavand, K.A., Saelens, B.E., Frank, L.D., Geremia, C.M., Glanz, K., King, A.C., and Sallis, J.F. (2016). Disparities in pedestrian streetscape environments by income and race/ethnicity. SSM-Population Health, 2, 206-216.

Engelberg, J.K., Conway, T.L., Geremia, C., Cain, K.L., Saelens, B.E., Glanz, K., Frank, L.D., and Sallis, J.F. (2016). Socioeconomic and race/ethnic disparities in observed park quality. BMC Public Health, 16:395.

Research brief


James Sallis, PhD, FACSMJames F. Sallis, Ph.D, FACSM is former Vice President of ACSM and is a member of the ACSM Strategic Health Initiative on Health Equity. He has been studying physical activity about 40 years, and his research interests are promoting physical activity and understanding policy and environmental influences on physical activity, nutrition, and obesity.  He has authored over 700 scientific publications, is one of the world’s most cited authors, and is a member of the National Academy of Medicine.

American Fitness Index Anthem Foundation fresh food availability

Supporting Local Communities in the Fight Against Food Insecurity

The American Fitness Index serves as a tool and resource for community stakeholders to address conditions in the environments that negatively affect a person’s overall health and identifies target areas to create healthier, more active communities.

Eliminating food insecurity is a critical factor in improving the overall health and well-being of individuals in the communities we serve, which is why the Anthem Foundation recently partnered with The Food Trust. Our collaboration will expand The Food Trust’s community-based program, the Healthy Food Retail Initiative, aimed at increasing access to healthy food and promoting health equity in cites in Indiana, Ohio and California.

Through our work with ACSM and programs like the Indianapolis Healthy Food Retail Initiative with The Food Trust, the Anthem Foundation is committed to creating meaningful partnerships with organizations, targeting specific, preventable health concerns and addressing the conditions in our environments which negatively impact individuals within communities.

For example, the 2019 Fitness Index found that only 33.9 percent of Indianapolis residents are eating two or more fruits a day and just 15.1 percent of residents are eating three or more vegetables each day. Data also showed more than one in three Indianapolis residents live in low food access areas where fresh food is difficult to find. Through these findings, it was clear that far too many Hoosiers are living without reliable access to a sufficient supply of affordable, nutritious food.

Fortunately, our partnership with The Food Trust recently expanded the Healthy Food Retail Initiative into five additional communities on the Eastside of Indianapolis, with markets and convenience stores increasing inventory and promotion of fresh produce and other heart-healthy foods. These locations also serve as “community health hubs” by providing health screenings, nutrition education and cooking lessons.

We believe giving back is not only a privilege, but a responsibility that we all share. Since the Foundation’s inception, we have remained committed to improving health and strengthening local communities through contributions to organizations committed to empowering communities to create healthier generations.


Author: Stephen Friedhoff, MD, Chief Clinical Officer, Anthem, Inc.

Since 2006, the Anthem Foundation has awarded the American College of Sports Medicine (ACSM) over $1.2M as a founding partner to establish the American Fitness Index.

Seasonal shopping at your local farmers market

Eating a wide variety of colorful fruits and vegetables is the ideal way to get the necessary vitamins and minerals that your body needs. Planning meals around food that is in-season is a great way to stay healthy and keep variety in your diet!

Now that you know eating seasonally has great health benefits, how do you start planning your fresh meals? The first step is knowing where to buy ingredients. Your local farmers market is the perfect place to get seasonal produce because the sellers have likely traveled less than 50 miles from where they grow to get to the market. You can’t get fresher than that! An added bonus to shopping at your local farmers market is that you are supporting growers in your own community. This helps to build and maintain your local economy, as well as strengthen the ties of your neighborhood. Finally, many farmers markets also accept Supplemental Nutrition Assistant Program (SNAP) and Women, Infants, and Children (WIC) vouchers to make sure that fresh food is accessible to all. Not sure where the closest farmers market is located? The US Department of Agriculture (USDA) has a search tool!

The next step in planning fresh meals is knowing which produce is currently in-season in your area. This can vary depending on the climate in your hometown, but the below chart can be used as a basic reference.

seasonal produce chart

To find seasonal food in your area, use the Seasonal Food Guide.

Now it’s time to have fun and decide which foods you will eat! Try mixing in your favorites, as well as some new options to keep meals exciting and maximize your nutrient intake. Want to try a new food, but not sure the best way to prepare it? Ask the seller! As the one who has grown the food, they will be very familiar with its flavor and will be able to recommend what other foods pair well. Enjoy!

Download the above chart as a PDF. 

Changes in the 2019 ACSM American Fitness Index: What Impact Will They Have?

Since the creation of the ACSM American Fitness Index®, the data team constantly looks for ways to improve the rankings. Also, as data sources change the information they gather, we must make changes in the indicators that are used. Both improvements and data source changes took effect as we prepared the 2019 Fitness Index rankings.

The data team worked closely with the experts on the Fitness Index Advisory Board to add four new measures to make the Fitness Index more complete:

  • Complete Streets policy
  • Pedestrian fatality rate
  • Bike Score®
  • Air quality index

These new indicators reflect the importance of policy and built environment in supporting active living that will lead to improved personal health outcomes. For example, cities that successfully implement Complete Streets policies can reduce pedestrian fatalities. Likewise, cities with high Bike Scores help to ensure bicyclists are safe and comfortable riding for transportation and recreation, which improves physical and mental health. While air quality is not often thought of in relation to physical activity, poor air quality has been shown to discourage physically active lifestyles, especially among people with respiratory limitations like asthma or COPD.

The data team also removed three indicators to help balance the Fitness Index and removed one indicator that no longer had a reliable data source:

  • Parkland as percentage of city
  • Acres of parkland/1,000 residents
  • Dog parks/100,000 residents
  • Percentage of residents getting 7+ hours of sleep/day

The three park-related indicators were removed to focus on the built environment characteristics that have a measurable effect on physical activity behaviors and health outcomes. The Behavior Risk Factor Surveillance System stopped regularly asking how much sleep people got on average; as a result, the sleep measure was removed from the list of indicators.

The data team also made some adjustments in the placement and weight applied to a few indicators to improve balance and consistency. Even with these changes, the 2019 Fitness Index includes the same number of indicators as were used in 2018 (33), and most of the indicators did not change.

The data team and Fitness Index Advisory Board do not make decisions about changes in the Fitness Index lightly, because cities need to know if their level of “fitness” is getting better from year to year. A lot of discussion and debate occurs among our expert advisors whenever changes are considered. The experts must be convinced that the changes follow current scientific thinking and will make the Fitness Index better; however, we also realize substantial changes cause problems when comparing rankings and scores over time.

With these changes, you might be wondering, “How do these changes impact my city’s score and ranking for 2019?” We believe that the 2019 Fitness Index is a more accurate and fair measure of your city’s fitness, which is a really good thing. However, when you compare the rankings and scores in 2019 to those reported in 2018, part of the shift may be due to the changes in the methods. For example, cities that have invested in making their streets and neighborhoods safer for walking and biking may see a better ranking in 2019 compared to last year, while cities that have larger and more parks may see a drop in the rankings due to these changes.

Advice for interpreting your city’s rank and scores for 2019

Although it is a natural inclination, please don’t compare the overall ranking and scores to those of previous years. Part of the change in rankings could be due to the updates that were made this year. Instead, look at where your city falls generally in relation to the other cities on the list. Is your city in the top 25, in the bottom 25 or somewhere in the middle?

What you also can and should do, is compare your city’s individual indicators from 2018 to 2019 to see which ones improved. After all, the goal of the Fitness Index is to see if your city’s residents are getting healthier and if there have been improvements in your city’s infrastructure to encourage healthy behaviors.

As always, our team here at the American College of Sports Medicine supports and applauds your efforts to become more fit and healthy! We believe the 2019 Fitness Index rankings can help inform decisions that will make your city and its residents healthier.

The 2019 American Fitness Index rankings will be released on May 14, 2019. 

Sign up to get exclusive insights into the report on the day of the release.


Author: Terrell W. Zollinger, Dr.P.H, MSPH

Five Frequently Asked Questions About the Physical Activity Guidelines for Americans, 2nd Edition

In 2008, the US Department of Health and Human Services (DHHS) issued the federal government’s first-ever Physical Activity Guidelines for Americans (Guidelines) to help Americans understand the types and amounts of physical activity that offer important health benefits. Given the extensive amount of new information available over the past decade, DHHS released the second edition of the Physical Activity Guidelines for Americans on November 12, 2018.


#1 How many Americans meet the Physical Activity Guidelines?

In 2017, only about 20% of high school students and 25% of adults reported getting enough physical activity to meet the aerobic and muscle-strengthening guidelines.


#2 How much physical activity do school-aged youth and adults need?

The guidelines for children and adolescents are as follows:

  • It is important to provide young people opportunities and encouragement to participate in physical activities that are appropriate for their age, that are enjoyable and that offer variety.
  • Children and adolescents aged six through 17 years should do 60 minutes or more of moderate-to-vigorous physical activity daily:
    • Aerobic: Most of the 60 minutes or more per day should be either moderate- or vigorous-intensity aerobic physical activity and should include vigorous-intensity physical activity on at least three days a week.
    • Muscle-strengthening: As part of their 60 minutes or more of daily physical activity, children and adolescents should include muscle-strengthening physical activity on at least three days a week.
    • Bone-strengthening: As part of their 60 minutes or more of daily physical activity, children and adolescents should include bone-strengthening physical activity on at least three days a week.

The guidelines for adults are as follows:

  • Adults should move more and sit less throughout the day. Some physical activity is better than none. Adults who sit less and do any amount of moderate-to-vigorous physical activity gain some health benefits.
  • For substantial health benefits, adults should do at least 150 minutes to 300 minutes a week of moderate-intensity, or 75 minutes to 150 minutes a week of vigorous-intensity aerobic physical activity, or an equivalent combination of moderate- and vigorous-intensity aerobic activity. Preferably, aerobic activity should be spread throughout the week.
  • Additional health benefits are gained by engaging in physical activity beyond the equivalent of 300 minutes of moderate-intensity physical activity a week.
  • Adults should also do muscle-strengthening activities of moderate or greater intensity and that involve all major muscle groups on two or more days a week, as these activities provide additional health benefits.

See Physical Activity Guidelines for Americans, 2nd Edition for additional key guidelines for the following populations:

  • Preschool-aged children.
  • Older adults.
  • Women during pregnancy and the postpartum period.
  • Adults with chronic health conditions and adults with disabilities.
  • Safe physical activity.


#3 To meet the current Physical Activity Guidelines, do Americans need to be more or less active compared to what was first recommended in 2008?

The new evidence reinforces the amounts and types of physical activity recommended for youth and adults in the 2008 Guidelines. The total amount of physical activity didn’t change in the second edition of the Guidelines. However, unlike the 2008 Guidelines, with the current Guidelines, moderate- and vigorous-intensity physical activity no longer needs to occur in bouts of at least 10 minutes to count towards meeting the adult aerobic activity guideline.


#4 What has changed in this second edition of the Guidelines?

This second edition of the Guidelines reflects the extensive amount of new knowledge gained since the 2008 release of the first edition of the Guidelines. This second edition of the Guidelines discusses the proven benefits of physical activity and outlines the amounts and types of physical activity recommended for different ages and populations. For example, new aspects include discussions of:

  • Immediate and longer-term benefits for how people feel, function and sleep after being physically active.
  • Additional health benefits of physical activity related to brain health, additional cancer sites and fall-related injuries.
  • Further benefits of being active among older adults and people with additional chronic conditions.
  • Risks of sedentary behavior and their relationship with physical activity.
  • Guidance on activity levels for preschool children aged three through five years.
  • Elimination of the requirement for physical activity of adults to occur in bouts of at least 10 minutes.
  • Tested strategies that can be used to get the population more active.


#5 Where can I find more information?

Learn more about the latest Physical Activity Guidelines for Americans. You can also explore the Move Your Way for interactive tools (like the one below), motivational videos, and helpful tips to make it easier to move more and sit less. Remember, physical activity can make you feel better right away including:

  • Boosting your mood,
  • Sharpening your focus,
  • Reducing your stress, and
  • Improving your sleep.

Author: Kathleen B. Watson, Ph.D. 

2018 Physical Activity Guidelines – How to Meet the Goals in Everyday Activities

The other day I heard a story about a woman who hated to exercise. She wanted nothing of it: going to the gym, sweating, walking on the treadmill. Boring. No way! She’d heard about the latest 2018 U.S. Physical Activity Guidelines, but had dismissed them as irrelevant to her life.

Recently, she stumbled onto an article that said the activities she was doing in everyday life counted as exercise and that moving more could actually make her feel better. “Cleaning the house, sweeping the porch, mowing the lawn, and walking my child to school are exercise? Really? I need to learn more!”

Off she went to search the internet. She discovered the Compendium of Physical Activities that listed MET values for hundreds of activities. METs? What are those? After learning that METs are a multiple of energy expended at rest (1 MET), the woman got a paper and pen and went to work. She listed all of her daily activities and how much time she did them each week. Then she separated the activities into light-, moderate-, and vigorous-intensity categories based on the MET values. Low and behold, she spent a lot of time in moderate activities and even some in vigorous activities. Amazing!

She wondered, how many minutes are ‘enough’? She remembered the 2018 U.S. Physical Activity Guidelines and went back to the internet. The guidelines recommended that she should “move more and sit less throughout the day.” Check! She did that.

The guidelines also recommended that she also “do at least 150 – 300 minutes of moderate-intensity activities (3.0-5.9 METs) or 75 minutes of vigorous-intensity activities (6.0 and higher METs), or a combination of the two intensities each week. Preferably the activities should be aerobic. And every minute counted.” Based on her list of activities and METs, she was close to meeting that goal too. She was on a roll!

The third guideline stopped her in her tracks. They recommended she “do at least two days of muscle-strengthening activities of moderate or greater intensity that involve all her major muscle groups.” Whoa. She didn’t do any muscle strengthening activities. She had no idea what were her major muscle groups.

Back to the internet for more information.

The woman learned that it’s important to work the major muscle groups: the chest, shoulders, back, biceps and triceps, legs and calves, and stomach. Oh. No way she worked these muscle groups at least two days a week, let alone one day a week.

To get help with where to start, the woman went to a nearby gym and worked with a trainer who showed her exercises to strengthen her muscles. She added these exercises to her schedule twice a week and, she liked it! She was getting stronger, her body was firming up and she liked how she felt during and after her workouts. She was sweating and loving it!

Before she knew it, the woman was looking for ways to get moving intentionally. She dusted off that old bicycle in the garage and took it for a spin. She bought a fitness tracker and took the long way to pick up her child at school. She even signed up for an exercise class to get more minutes of vigorous-intensity activities. Moving more had become a part of her life. Everything she was doing, even the bite-sized amounts of activity, counted toward her activity goals. She felt great, slept better, and had more energy.

The moral to this story is that if we move every day, we are doing positive things for our mental and physical health. The new 2018 U.S. Physical Activity Guidelines tell us how much activity we need on a regular basis to improve our health and reduce our risk of chronic diseases. So here’s to an active and healthy 2019 as we aim for every child, adult and senior to reach the goals set in the 2018 U.S. Physical Activity Guidelines.


Author: Barbara E. Ainsworth

Getting up to speed on Complete Streets: 9 things you should know

Complete Streets. You’ve heard of it, but you’re not exactly sure what it means or how it can benefit your community. Our friends at the National Complete Streets Coalition (NCSC) put together a handy Q&A to help understand some of the basics of Complete Streets.

#1 Who is the National Complete Streets Coalition?

The National Complete Streets Coalition, a program of Smart Growth America, is a non-profit, non-partisan alliance of public interest organizations and transportation professionals committed to the development and implementation of Complete Streets policies and practices.

We believe that the streets of our cities and towns must allow all people, regardless of age, ability, income, race or ethnicity, to safely, comfortably and conveniently access homes, employment centers, schools, shops, health facilities and other destinations by foot, bicycle, public transportation, car or truck. A community’s street network should reflect the current and planned built environments and support overall public and economic health.

#2 What are Complete Streets?

A nationwide movement launched by the Coalition in 2004, Complete Streets means putting people first whenever we plan, design, construct, operate and maintain our street networks.

#3 Who are Complete Streets for?

Complete Streets serve the needs of all people who use the road equitably, particularly the most historically underinvested and underserved communities and the most vulnerable users of our roads, including people walking or biking, older adults and people of color. Transportation choices should be safe, convenient, reliable, affordable, accessible and timely. These options should be available to all people, regardless of race, ethnicity, religion, income, gender identity, immigration status, age, ability, languages spoken or level of access to a personal vehicle.

#4 What does it mean to create Complete Streets?

Creating Complete Streets means transportation agencies must change their approach to community roads and think about streets as places for people, not just cars. By adopting a Complete Streets policy, communities direct their transportation planners and engineers to routinely design and operate the entire right of way to ensure all people can safely access the street, regardless of age, ability or mode of transportation. This means that every transportation project will make the street network better and safer for drivers, transit users, pedestrians, and bicyclists—making your town a better place to live. Read more about the benefits of Complete Streets.

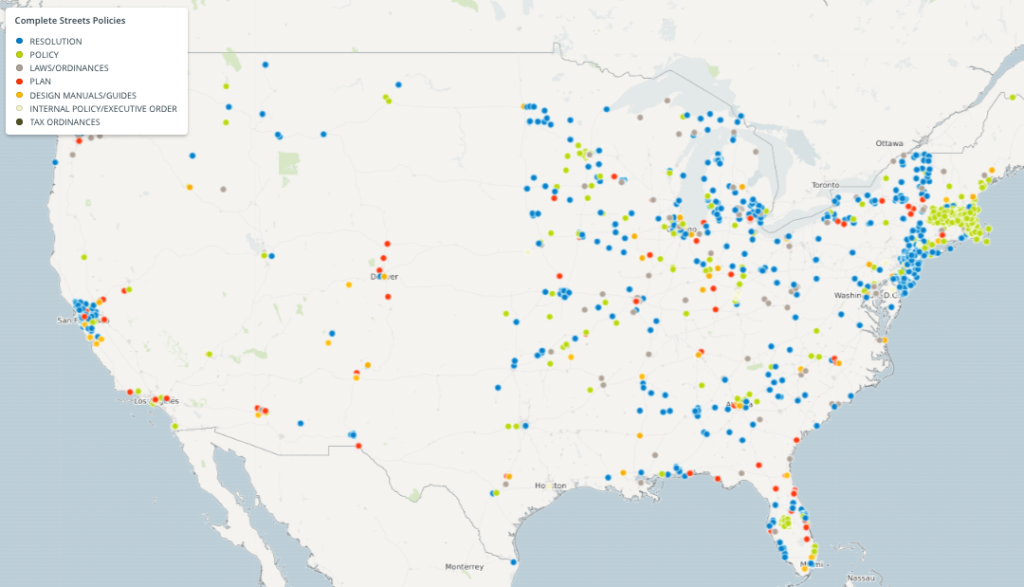
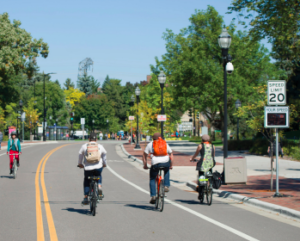
#5 What do Complete Streets look like?

There is no singular design prescription for Complete Streets; each one is unique because it responds to its community context. A complete street may include:

  • sidewalks
  • bike lanes (or wide paved shoulders)
  • special bus lanes
  • comfortable and accessible public transportation stops
  • frequent and safe crossing opportunities
  • median islands
  • accessible pedestrian signals
  • curb extensions
  • narrower travel lanes
  • roundabouts

A complete street in a rural area will look quite different from a complete street in a dense, urban area, but both are designed to balance safety and convenience for everyone using the road (not just cars). Check out examples of Complete Streets case studies.

#6 Why would I want my community to have a Complete Streets policy?

Across the country and on Capitol Hill, Complete Streets policies have been gaining traction as more places realize the benefits of having safe, accessible and healthy streets in their communities.

With a Complete Streets policy in place, communities can work toward creating complete networks so people can safely and comfortably walk or bike anywhere they need to go. Complete Streets create opportunities for people to get physical activity in their day-to-day lives. They can connect people to schools, jobs, healthy foods, parks and other community amenities. And Complete Streets aren’t just safer and healthier – they also help create stronger economies, boosting jobs and revenue for local businesses.

#7 What’s in a Complete Streets policy?

Complete Streets can be achieved through a variety of policies:

  • ordinances and resolutions
  • rewrites of design manuals
  • inclusion in comprehensive plans
  • internal memos from directors of transportation agencies
  • policies adopted by city and county councils
  • and executive orders from elected officials, such as Mayors or Governors.

The strongest policies should include ten core elements, including identifying the most vulnerable users who the policy will benefit, committing to implement the policy in all transportation projects, working together with private developers and other jurisdictions, defining how the policy will measure success and setting up the next steps needed to implement the policy. Download the 10 elements.

#8 Does my community have a Complete Streets policy?

The National Complete Streets Coalition maintains an inventory of adopted Complete Street policies across the U.S. In total, over 1400 Complete Streets policies have been passed in the United States, including those adopted by 33 state governments, the Commonwealth of Puerto Rico, and the District of Columbia. View Complete Streets policy atlas.

#9 Okay, I’m convinced. My community needs a Complete Streets policy. Where do I start?

Our policy framework, the Elements of a Complete Streets Policy, is an excellent place to start. Based on decades of collective expertise in transportation planning and design, the ten elements serve as a national model of best practices that can be implemented in nearly all types of Complete Streets policies at all levels of governance.

Eager for more information? You can subscribe to the National Complete Streets Coalition newsletter and follow them on twitter. The coalition also works directly with communities to help them develop, adopt and implement strong Complete Streets policies. Learn more about their technical assistance work.